Agile Defect Management | Turtle Framework
Hi All
It's been a while since we last connected. I am excited to connect with you all after a long time. Thought I write something on Agile Defect Management with so many of our projects using Agile methodologies, it can be useful for keeping things running smoothly as I have come with the Turtle framework. This approach improves process clarity and efficiency, fosters communication among team members, and simplifies the path to process improvement, leading to a more effective and rewarding workflow
Agile Defect Management through the Turtle Lens
I was going through one of the Audit processes. I saw Turtle process is being used and thought why can’t it be used in the Agile Project Management process, especially in improving defect management?
Most of the teams get confused between Defects & Bugs.
We always treat defects like bugs, whereas bugs are not the same as defects.
Bug: If the software is missing something in the ‘Code’, it is a coding error
Effort: It usually takes 1–8 hours to fix a bug
Defect: If software is missing something from the actual requirements
Effort: It usually takes 2hr to 1 Sprint.
Now that you have better understanding between bug and defect. Lets delve into the defect management lens.
What is a TURTLE framework?
When planning a vacation, meticulous consideration is given to various pivotal elements such as accommodation, travel arrangements, weather conditions, suitable attire, potential attractions, and, of course, budgetary constraints. This comprehensive process mapping is instrumental in ensuring a well-organized and enjoyable holiday experience.
In a parallel vein, the utilization of a Turtle Framework proves invaluable in conducting a meticulous analysis of any given process; in this instance, we will delve into the intricacies of defect management.
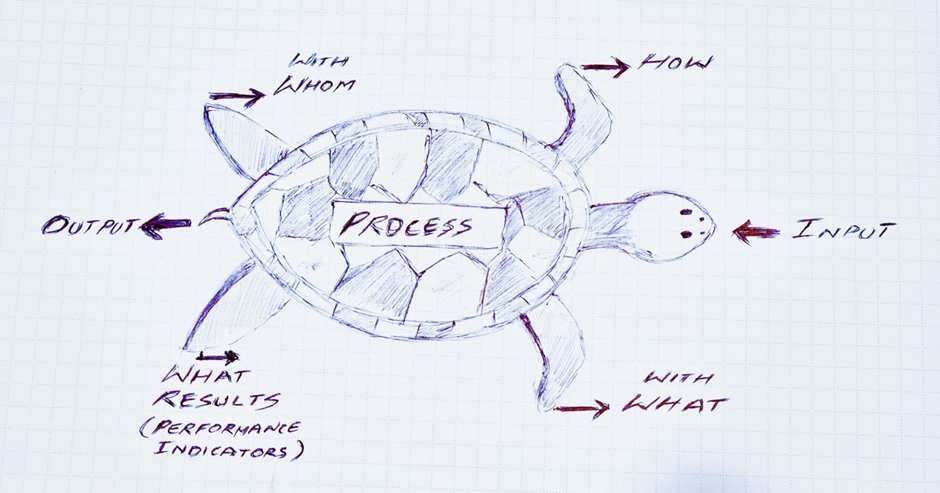
There are 6 areas of the Turtle Diagram:
1) Inputs
2) Outputs
3) How
4) With what
5) With whom
6) What results (performance indicators)
Envision “Defect Management” situated within the Turtle’s core, as we engage in a collaborative exploration with a dedicated team.
Through this lens, we scrutinise the following dimensions, unravelling the intricacies of the defect management process:
Process Overview:
- Examine the defect management process comprehensively, delineating its stages, intricacies, and key components.
Interconnected Areas:
- Identify and analyze the various facets that interact with the defect management process, both internally and externally. Understand the interdependencies and relationships with other organizational elements.
Resource Requirements:
- Illuminate the support and resource prerequisites essential for the seamless execution of the defect management process. Consider personnel, technology, and any other assets vital for its success.
Procedural Guidelines:
- Define the procedural steps to be followed in defect management. Establish a clear and structured framework that ensures consistency and efficiency in addressing and rectifying defects.
Output Analysis:
- Evaluate the tangible and intangible outputs generated by the defect management process. This includes not only the resolution of defects but also the potential improvements and lessons learned for future enhancements.
By adopting this methodical approach within the Turtle Diagram framework, we gain a holistic understanding of the defect management process.
This enables us to make informed decisions, allocate resources judiciously, and continually refine our procedures to uphold the highest standards of quality and efficiency.
How do we know whether this is actually working fine or not, for this we will have some performance indicators.
Here’s the Defect Management process adapted using the 6 areas of a Turtle Diagram which can be used
Target Audience:
- Teams working on quality and defect management improvement.
- Organizations setting guidelines for defect management at the team level.
1. Inputs:
· Defect reports: Internal/external issues related to software, products, or services, encompassing delays, escaped defects, resolution times, and static analysis tool findings.
· Customer feedback: Inputs highlighting specific defects.
· Testing results: Data from testing activities revealing defects.
· Historical defect data: Records of past defects, resolutions, and recurring patterns.
2. Outputs:
· Resolved defects: number of defects logged, Issues that have been fixed, replicated, or corrected.
· Improved products or services: Enhanced quality and reliability through defect resolution.
· Defect prevention plans: Actions to minimize future occurrences, average time to resolution
· Root cause analysis reports: Investigations into the underlying reasons for defects.
· Lessons learned: Knowledge gained to improve defect management practices.
· Increased customer satisfaction.
3. How (Support processes, procedures, methods):
Defect tracking system: Tools like Jira or ADO for logging, tracking, and managing defects.
· Defect prioritization: Ranking defects based on severity and impact.
· Acceptance Criteria: Well-defined DoR & DoD by the team
· Root cause analysis: Techniques to identify underlying defect causes.
· Defect resolution: Procedures for fixing, remediating, or correcting defects.
· Defect prevention: Strategies to reduce future defect occurrences.
· Defect reporting: Processes for communicating defect status and updates.
4. With what (Materials and equipment used):
· Defect tracking tool
· Testing tools: Resources for identifying defects during testing phases.
· Communication and collaboration tools: Slack, Team, etc., for sharing information and coordinating efforts.
· Data analysis tools: Software for analyzing defect trends and patterns.
5. With whom (Competence, skill, training):
· Defect analysts: Individuals responsible for analyzing and triaging defects.
· Developers or engineers: Teams responsible for fixing or remediating defects.
· Testers: Individuals responsible for identifying defects during testing.
· Project managers: Individuals overseeing defect management within projects.
· Quality assurance professionals: Experts in quality management and defect prevention.
6. What results — (Performance indicators):
· Defect resolution rate: Percentage of defects resolved within defined timeframes.
· Defect escape rate: Percentage of defects reaching customers.
· Defect severity: Distribution of defects by severity level.
· Defect density: Number of defects per unit of code, product, or time.
· Customer satisfaction: Metrics related to customer satisfaction with quality.
· Cost of quality: financial impact of defects, including prevention, detection, and resolution costs.
· Time to resolution: Average time taken to resolve defects.
· Rework rate: Percentage of work needing to be redone due to defects.
OUTCOME:
· Reduced number of production bugs
· improved quality, increased customer satisfaction
· Improved project outcomes
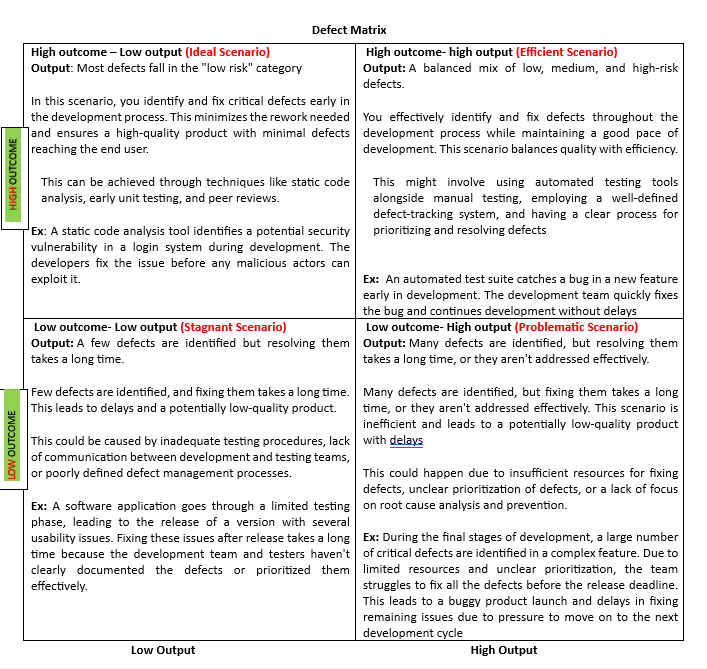
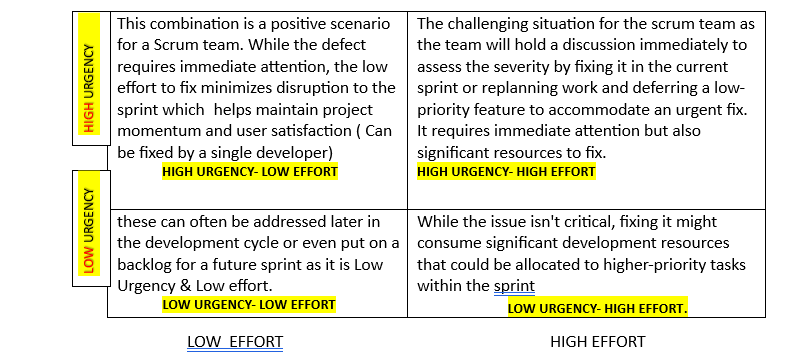
Sharing two defect matrixes for scrum teams to go through to understand defects


No comments:
Post a Comment
Note: Only a member of this blog may post a comment.